Ncstar
18031 Cortney Ct, City Of Industry, Ca 91748, Us
Location matches found: Industry(nearest)>Los Angeles County>California
Most Recent Shipment: 03/28/2024 (Database Updated: 03/31/2024)
Avg. TEU per Shipment: 1.43
Avg. TEU per Month: 3.33
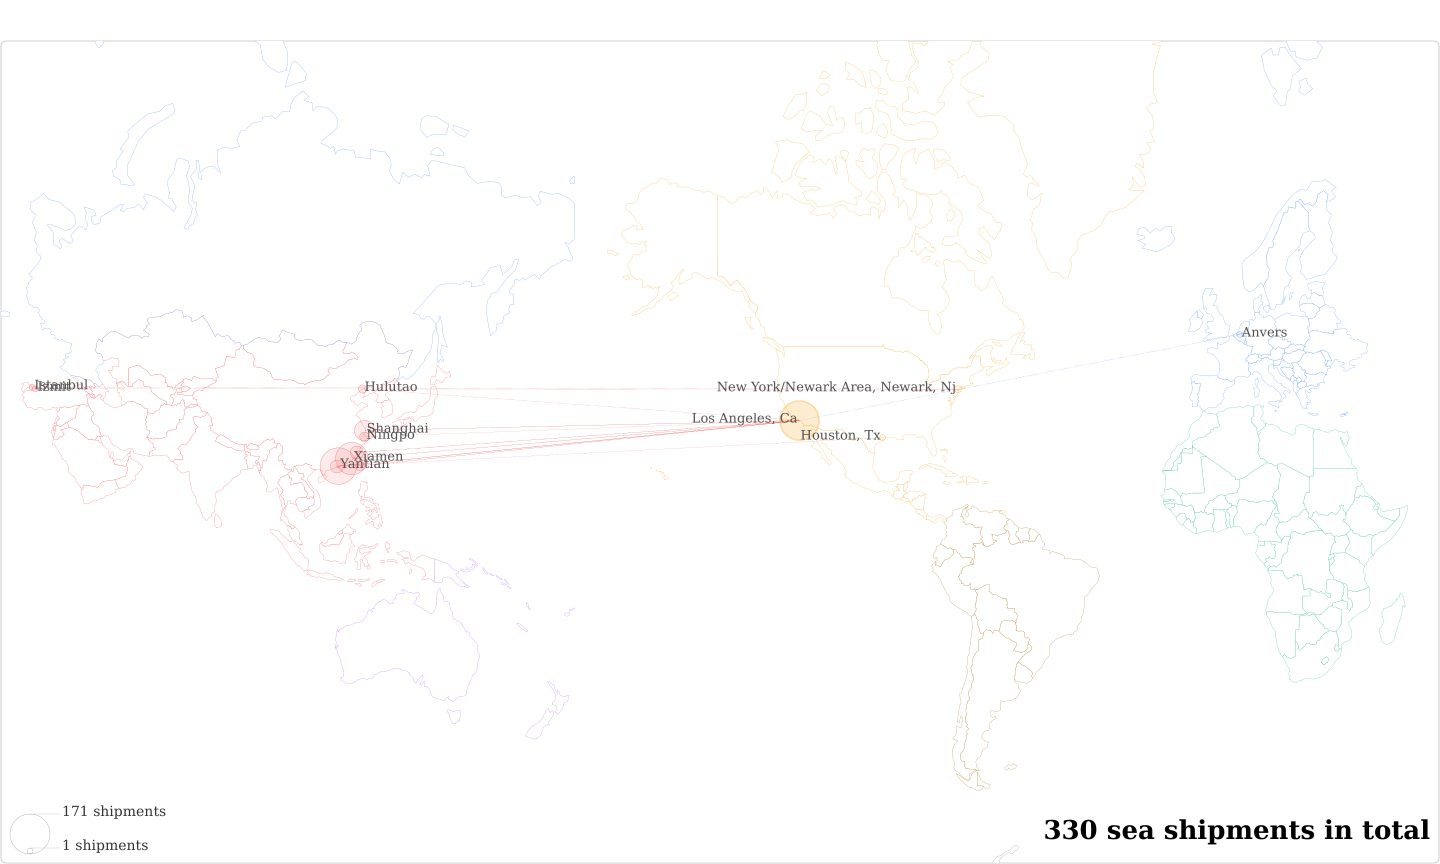
Total Sea Shipments: 330
Est. Total Shipping Spend: $902,539.64 (88.18% coverage)?Benchmark your shipping spend
Ncstar's Total Sea Shipments Over Time
(png)
(jpeg)
(svg)
Showing data from
Jan 2015
to
Apr 2024
View data for the past:
Organize bars by:
Plot events:
Last Month's Total Shipments: 328.57% (1Y)
Ncstar's Suppliers
Ncstar's Annual Importing Frequency (png) (jpeg) (svg)
(png)
(jpeg)
(svg)
Ncstar's Product Breakdown (H.S. Code) (png) (jpeg) (svg)
(png)
(jpeg)
(svg)
Ncstar's Top 10 Relationships (png) (jpeg) (svg)
(png)
(jpeg)
(svg)
Legend:
This company
Its suppliers
Other companies using the supplier
This company
Its suppliers
Other companies using the supplier
Breakdown of Ncstar's Imports Per Country
(png)
(jpeg)
(svg)
FCL vs LCL Shipments
- FCL: 330 shipments
- LCL: 0 shipments
Shipments Breakdown by Bill Type
house: 326 shipments
See all house shipmentsregular: 4 shipments
See all regular shipmentsNotify Party Stats
- with Notify Party: 245 shipments
- without Notify Party: 85 shipments
| Date | Bill of Lading | Suppliers | Weight | No. of Containers | Description | Est. Freight Cost ? |
|---|
No results.