Hubei Haowei Technology
Rd4 West Economic Development District
Quick search: Name
Name Address
 Address(maps)
 LinkedIn
 Alibaba
 AliExpress
 Global Sources
 HKTDC
HKTDC 1688
1688 Want to send an RFI or RFQ to this supplier? Try LightSource for your strategic sourcing.
Most Recent Shipment: 03/28/2024 (Database Updated: 03/31/2024)
Avg. TEU per Shipment: 1.49
Avg. TEU per Month: 5.71
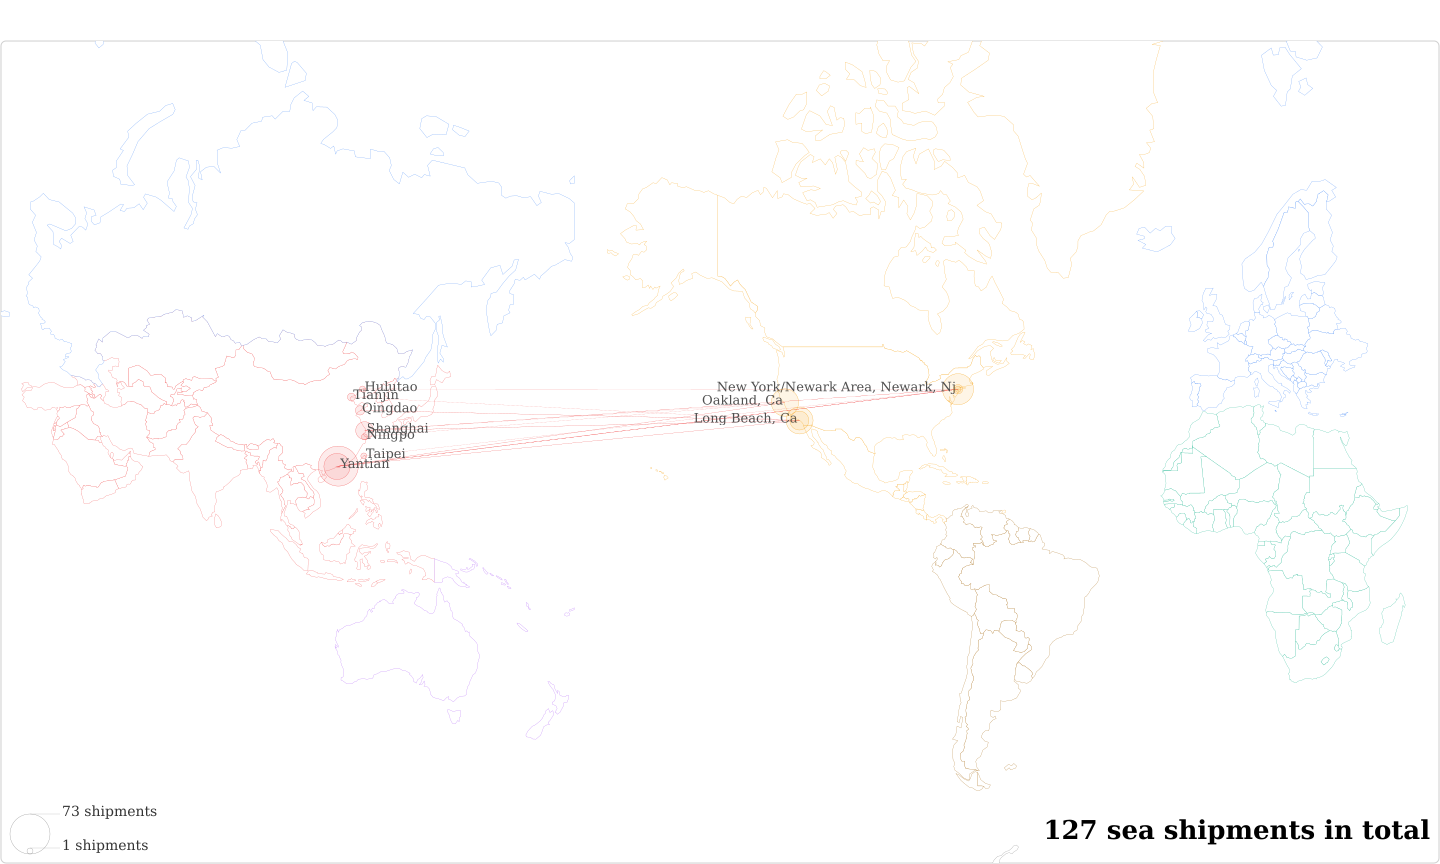
Total Sea Shipments: 123
Est. Total Shipping Spend: $230,953.5 (63.41% coverage)?Benchmark your shipping spend
Hubei Haowei Technology's Total Sea Shipments Over Time
(png)
(jpeg)
(svg)
Showing data from
Jan 2015
to
Apr 2024
View data for the past:
Organize bars by:
Plot events:
Last Month's Total Shipments: 8128.57% (1Y)

Hubei Haowei Technology's Customers
Hubei Haowei Technology's Annual Importing Frequency (png) (jpeg) (svg)
(png)
(jpeg)
(svg)

Hubei Haowei Technology's Product Breakdown (H.S. Code) (png) (jpeg) (svg)
(png)
(jpeg)
(svg)

Hubei Haowei Technology's Top 10 Relationships (png) (jpeg) (svg)
(png)
(jpeg)
(svg)
Legend:
This supplier
Its customers
Other suppliers used by the customer
This supplier
Its customers
Other suppliers used by the customer

Breakdown of Hubei Haowei Technology's Exports Per Country
(png)
(jpeg)
(svg)


Shipments Breakdown by Bill Type
house: 107 shipments
See all house shipmentsregular: 16 shipments
See all regular shipmentsNotify Party Stats
- with Notify Party: 42 shipments
- without Notify Party: 81 shipments
| Date | Bill of Lading | Customers | Weight | No. of Containers | Description | Est. Freight Cost ? |
|---|
No results.