Ningbo Zhongbei Import & Export C
Bld F Bohong Industry Zone Sangya Yinzhou Area Ningbo Zhejiang China
Quick search: NameAddress
 Address(maps)
 LinkedIn
 Alibaba
 AliExpress
 Global Sources
 HKTDC
HKTDC 1688
1688 Want to send an RFI or RFQ to this supplier? Try LightSource for your strategic sourcing.
Most Recent Shipment: 03/17/2024 (Database Updated: 03/31/2024)
Avg. TEU per Shipment: 1.3
Avg. TEU per Month: 0.54
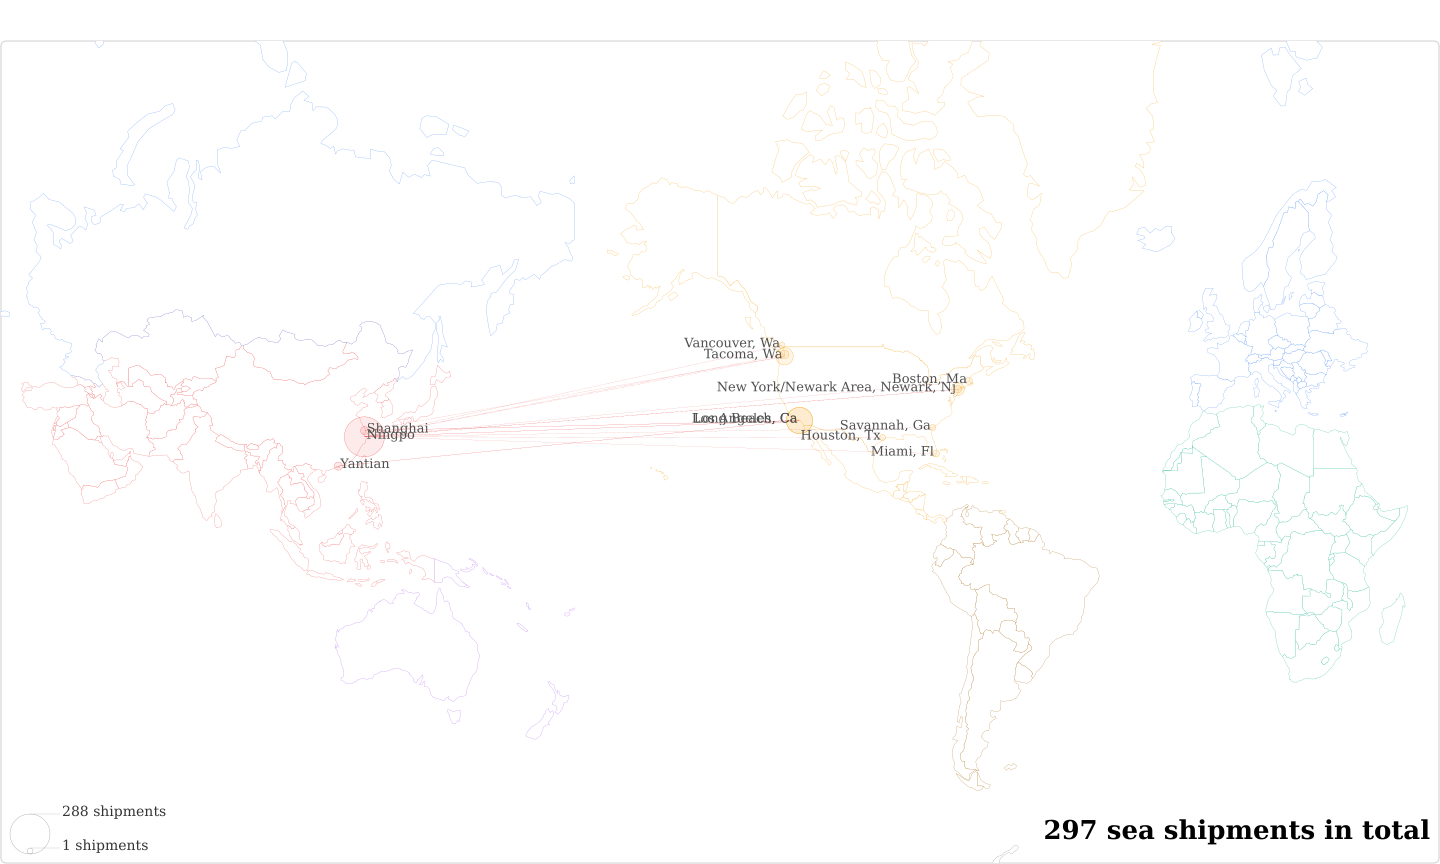
Total Sea Shipments: 296
Est. Total Shipping Spend: $418,068.4 (66.55% coverage)?Benchmark your shipping spend
Ningbo Zhongbei Import & Export C's Total Sea Shipments Over Time
(png)
(jpeg)
(svg)
Showing data from
Jan 2015
to
Apr 2024
View data for the past:
Organize bars by:
Plot events:
Last Month's Total Shipments: 1200.00% (1Y)
Ningbo Zhongbei Import & Export C's Customers
Ningbo Zhongbei Import & Export C's Annual Importing Frequency (png) (jpeg) (svg)
(png)
(jpeg)
(svg)
Ningbo Zhongbei Import & Export C's Product Breakdown (H.S. Code) (png) (jpeg) (svg)
(png)
(jpeg)
(svg)
Ningbo Zhongbei Import & Export C's Top 10 Relationships (png) (jpeg) (svg)
(png)
(jpeg)
(svg)
Legend:
This supplier
Its customers
Other suppliers used by the customer
This supplier
Its customers
Other suppliers used by the customer
Breakdown of Ningbo Zhongbei Import & Export C's Exports Per Country
(png)
(jpeg)
(svg)
Shipments Breakdown by Bill Type
house: 296 shipments
See all house shipmentsregular: shipments
See all regular shipmentsNotify Party Stats
- with Notify Party: 239 shipments
- without Notify Party: 57 shipments
| Date | Bill of Lading | Customers | Weight | No. of Containers | Description | Est. Freight Cost ? |
|---|
No results.